Warsh faces multiple alternative inflation signs as Fed charts new course
Kevin Warsh, Chairman of the Federal Reserve, speaking at the ECB Forum in Sintra, Portugal on July 1st, 2026.
CNBC
Federal Reserve Chairman Kevin Warsh has said that inflation is a “choice.” The same could also be true of how inflation is measured.
While the central bank has its own favorite metric courtesy of the Commerce Department, the public data base is rife with other gauges of how price pressures are best viewed.
It’s likely that many of them will get a serious look as the Warsh Fed plots what he called on Wednesday a “new course” for how it operates — and specifically what will be the data triggers for the ways it implements monetary policy.
“My hope, my aspiration, is that nine-12 months from now we’re going to be using new technologies to understand what’s happening in the real economy in a contemporaneous, real-time way that positions us as central bankers to make better decisions,” he said during a discussion at the European Central Bank Forum on Monetary Policy in Sintra, Portugal.
Warsh has formulated five task forces to look at an array of Fed functions. One will be data-focused while another will take a look at how officials measure, and react to, inflation.

The review is sure to be about more than the age-old battle between headline inflation and core inflation, the latter excluding the day-to-day necessities of gas and groceries because of how volatile those prices can be.
Instead, the Fed can use the process as a way to bring in other data points that paint a more complete picture of the cost-of-living challenges consumers face from inflation, which has been running hot for five years.
A variety of choices
These include measures from other central bank offices such as the Dallas Fed and its focus on “trimmed mean” inflation that includes outliers. Or the Atlanta Fed’s “sticky” and flexible” inflation that distinguishes between prices that tend to move up and down a lot and those that are steadier. There are also widely followed surveys from the University of Michigan and the New York Fed, as well as private sector measures such as the “Truflation” gauge that employs “cutting-edge technology to deliver the world’s only verifiable daily inflation indexes.”
Perhaps unsurprisingly, these measures can and do present very different pictures of inflation, with some reinforcing the view that prices are still too high and others saying the Fed might be closer to its 2% goal than traditional measures indicate.
“A good read on where inflation is headed is critical to whether the Fed needs to move rates,” Claudia Sahm, chief economist for New Century Advisors, wrote in a Substack post Tuesday. “But trend is not destiny — even a 2% trend is no guarantee of price stability, since actual inflation can diverge from trend as it does now.”
A basic view of the mainstream indicators shows inflation is well above the Fed’s 2% target.
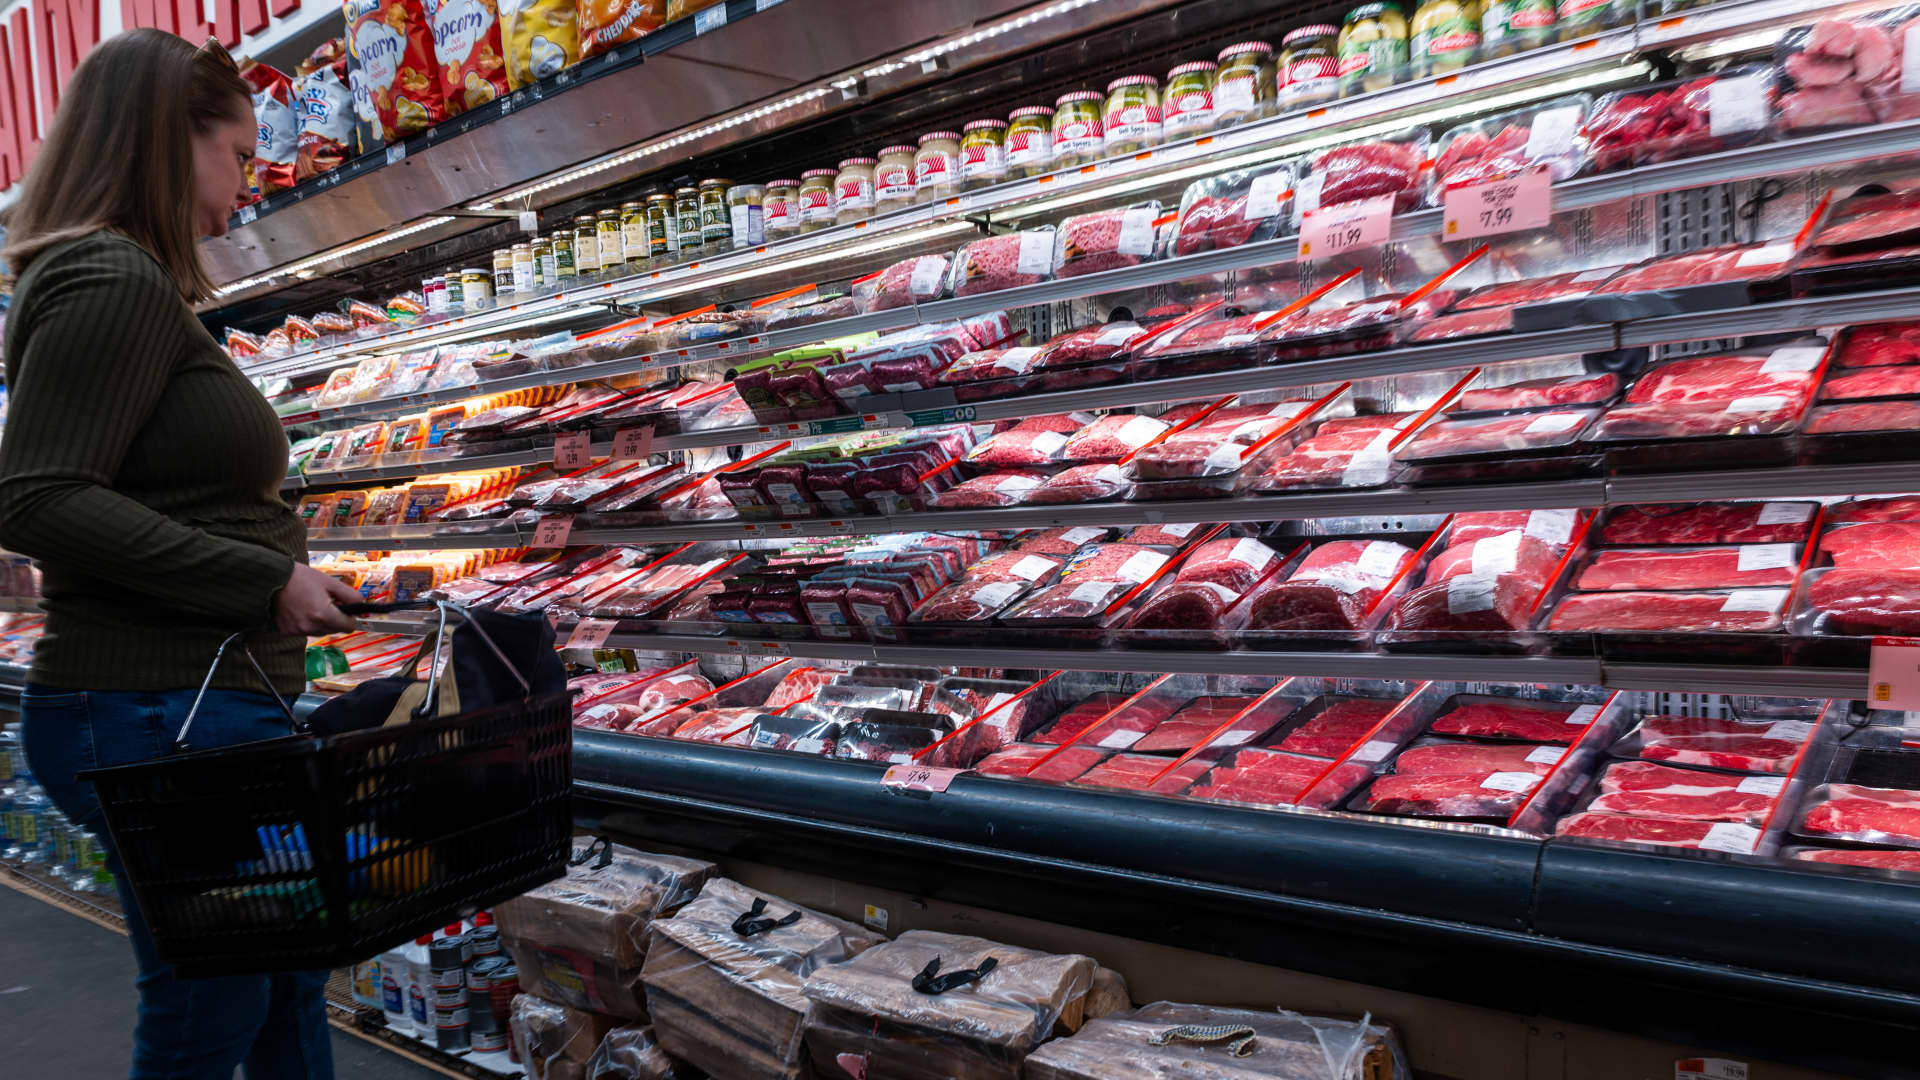
The consumer price index — a broad amalgam of what consumers pay for goods and services — showed headline inflation running at a 4.2% annual pace in May, with core inflation at 2.9%.
At the same time, the personal consumption expenditures price index — the Fed’s preferred gauge that is more aggressive at adjusting for consumers’ behavioral changes like substituting less expensive items for costlier ones — put the respective numbers at 4.1% and 3.4%. Economists largely believe core is a better long-run gauge of inflation as it omits the most volatile categories, particularly important now considering the Iran war’s impact on energy prices.
Outside the norm
Other indicators, though, show different results.
The Dallas Fed “trimmed mean,” an average of inflation figures that tosses out the 24% of items that have the lowest price changes and 31% with the highest, shows a 12-month rate of just 2.4%. But there’s one important caveat with what is otherwise considered a trusty metric: Dallas Fed President Lorie Logan has warned that the methodology as currently deployed may be discarding the wrong prices.
Elsewhere, the Atlanta Fed’s flexible and sticky price gauges present a fascinating dichotomy: sticky prices running at a 3.1% 12-month annualized rate, and flexible prices at 7%, the highest since November 2022.
On the other hand, Truflation paints a much more benign picture, at just 1.75%. The measure has mostly moved in-step directionally with the CPI and PCE gauges but showed a much higher peak of 11.5% in June 2022, a time when CPI had topped out around 9%.
Finally, market-based measures also point to a less severe inflation backdrops.

The 2-year Treasury yield, sensitive to the vagaries of Fed rate policy, popped following Warsh’s first news conference in June but has since eased a bit. Similarly, the Treasury market’s five-year inflation indicator has plunged since May and is now at just 2.26% and the one-year “breakeven” rate has fallen nearly half a percentage point since May, albeit still elevated around 3%.
For Warsh, all of these data points, plus others from various agencies, present a complicated mosaic that his task forces will have to sift through. The chairman on Wednesday indicated that the Fed’s criteria will change dramatically and be more responsive to the current environment.
“We’re no longer going to have to rely solely on data that we get from government agencies with mismeasurement problems that have surveys that are no longer relevant,” Warsh said. “If we do our jobs, we’ll be here a year from now, and we’ll say we’ve discovered data that helps us make better decisions, and we live up to our promise.”